Chino, Japan
Chino IR-ESC Series Scanning Type Radiation Thermometers

Made in Japan
Manufacturer: Chino Corporation
Model: IR-ESC Series
Scanning Unit
Models
| Types | Models |
|---|---|
| Scanning Unit Scanning Speed 5 times/sec. | IR-ESCF21N |
| Scanning Unit Scanning Speed 5 times/sec. Laser Spot Type | IR-ESCF21L |
| Scanning Unit Scanning Speed 10 times/sec. Viewfinder Type | IR-ESCF22F |
| Display Processing Unit Wndows95 | IR-EPW5 |
| Display Processing Unit WindowsNT4.0 | IR-EPN5 |
| Connecting Cable between Scanning Unit and Relay Terminal Unit | IR-ZECC□□□ |
| Connecting Cable between Relay Terminal Unit and Display Processing Unit | IR-ZEPC□□□ |
| Protective Case | IR-ZECS |
Features
IR-ESC series is a scanning type radiation thermometer, which achieves temperature pattern measurement of moving and rotating objects for width direction with low price. Measuring range is 100°C to 600°C, wide range. The thermometer is constructed by the scanning unit, display processing unit equipped with dedicated software, which operates and displays data graphical, and connecting cables. The scanning unit is compact and space efficient designed to fit in various facilities easily.
- Scanning unit is compact (300×200×120mm) and easy to install.
- Measuring range is 100°C to 600°C, wide range.
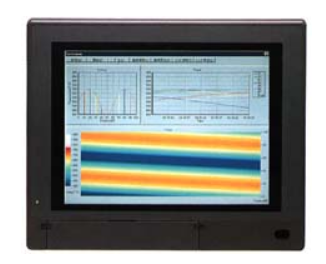
- Display processing unit is equipped with dedicated software to display thermal image of each mode: pattern, trend and color. (Windows 95 or Windows NT4.0, to be specified).
- Position 7-point+peak 1-point, or zone peak 3-point are output in 0 to 5 VDC.
- For checking measuring objects, viewfinder type and laser spotting type are available (Option).
- Kiln shell software dedicated to cement kiln is available.
Specifications
Scanning Unit
| Scanning System | Optical axis scanning by rotary mirror |
|---|---|
| Detecting Element | Cooling type PbSe |
| Scanning Angle | 90° |
| Scanning Speed | 5 times/sec., 10 times/sec. (specify) |
| Measuring System | Narrow band radiation thermometer |
| Measuring Temperature Range | 100 to 600°C |
| Accuracy Rating | Below 400°C: ±4°C 400°C or more: ±1.0% of measured value (ε≒1 at ambient temperature 23°C±5°C) |
| Resolution | Below 400°C: 3°C, 400°C or more: 2°C |
| Emissivity Compensation | 1.0 to 0.2 |
| Measuring Distance | 0.5m to ∞ |
| Instant Viewfield (mm□) | Measuring distance L (mm)/Measuring factor 150 |
| Response Time | 0.5ms (90% response) |
| Focusing System for Spot | Viewfinder or laser spot (option) Laser ON/OFF by switch, Laser 1mW or less 645mm class 2 |
| Output | Temperature pattern: 0 to 20mA DC, Peak temperature: 4 to 20mA DC, Scanning angle: Open-collector (Max. load voltage35V DC, Max. load current 10mA DC) |
| Emissivity Remote Setting | 4 to 20mA DC |
| Working Temperature Range | 0 to 50°C |
| Power Supply | 100-240V AC |
| Allowable Voltage Fluctuation | +10% to -15% of rated value |
| Power Consumption | Approx. 40VA |
| Connection | Connector connection |
| Connecting Cable Length | Max. 200m with dedicated cable |
| Case Material/Color | Aluminum/Gray |
| External Dimensions/Weight | 300W×200H×120Dmm, Approx. 6.5kg |
Display Processing Unit
| Number of Dots | Windows95 or WindowsNT4.0 (to be specified) |
|---|---|
| Number of Dots | 800×600 dots |
| Display | Thermal image display of each mode: pattern, trend and color |
| Input | 0 to 5V DC (Add 250Ω to 4 to 20mA DC from scanning unit) |
| Output | 0 to 5V DC (No isolation) |
| Output Point | (1)Position 7-point+peak 1-poit or (2)Zone peak 3-point at sampling mode |
| Software | Built-in thermal image software |
| Rated Power Supply Voltage | 100-240V AC 50/60Hz |
| Weight | Approx. 8.5kg |
Kiln Shell Software Specifications
| Function | Kiln shell hot spot monitoring (zone peak temperature graph/thermal image display/historical display/report output) |
|---|---|
| Screen Renewal Cycle | At every 2 kiln rotations |
| Hot Detection | Hot detection at the highest temperature in each zone (with a function detecting rate-of-change) Zone dividing number: 20 divisions (optional position setting) Hot detection: alarm setting temperature≦zone highest temperature, alarm setting, Alarm setting at each zone Radiation temperature measuring ran: 1°C step |
| Max. Scanning Number | 250 times/1 kiln rotation |
| Thermal Image Display Color | Color/°C (400 colors for measuring range 100 to 600°C) |
| Screen Display | Main screen
|
| Setting | Alarm setting |
| Data Storage | Zone highest/lowest temperature per hour, Each zone highest temperature per day, Thermal image development at detection of highest temperature per day, Highest/lowest/average temperature pattern per day, Semipermanent storage (Approx. 1GB of dedicated file in a year) Storage type: Dedicated file (auto storage, for replay) Excel 97 file format (data base and trend data per an hour) |
| History/Analysis | Data base replay/display at historical mode, Printer output of report
|
Related Products

REQUEST QUOTATION

PAYMENT

LINK