Japan, Jasco
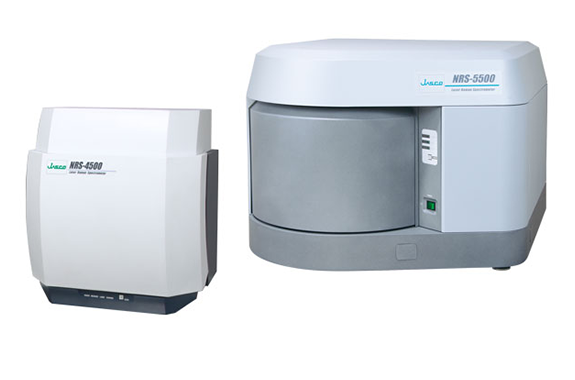
Jasco NRS-5500/7500 Laser Raman Spectrophotometer
Made in Japan
Manufacturer: Jasco
Model: NRS-5500/7500
Lineup
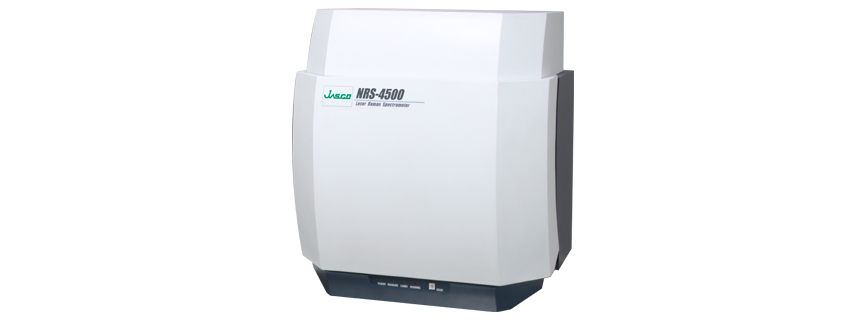
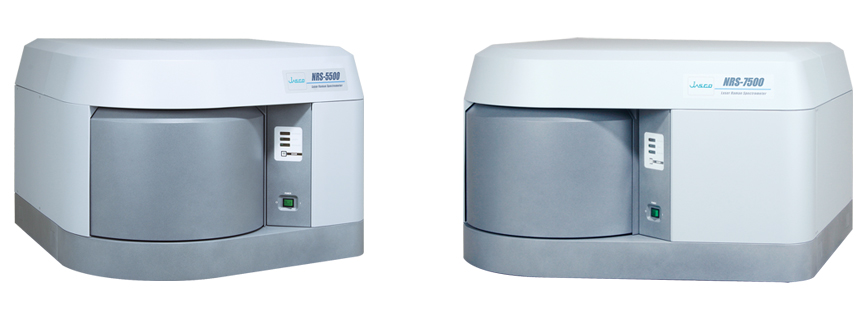
NRS-4500 NRS-5500/7500
Compact model that can be installed on a table High-end model with high spatial resolution
JASCO Raman Features
Raman measurement navigation functions (Focus NAV / View NAV / Search NAV)
- Focus NAV: Once you place the sample, autofocus is completed with one click. The stage will move up to 30 mm to achieve focus.
- View NAV: When switching objective lenses, the brightness is automatically adjusted. This prevents whiteout and blackout, and ensures that images are always displayed at a brightness that is easy to view.
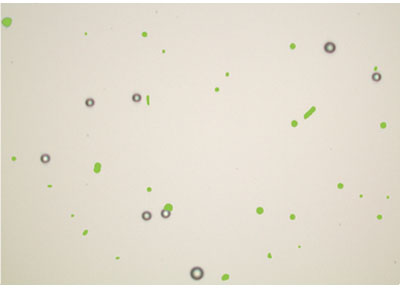
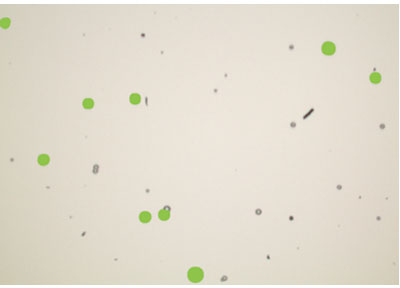
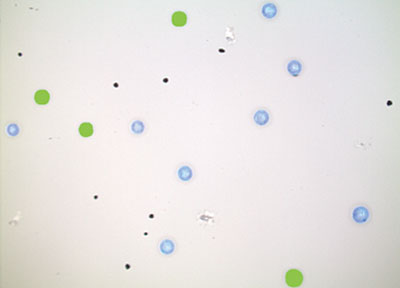
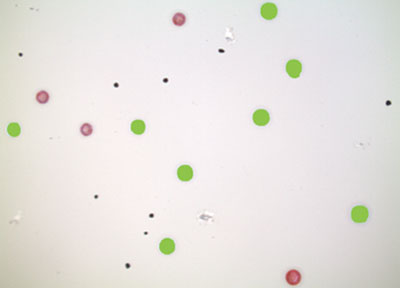
- Search NAV: Automatically recognizes measurement location candidates in real time and displays them on the observation image along with the number of recognized points. Recognized locations can be registered as measurement points all at once.
Advanced Search Navi
The features of the recognized sample can be measured, such as size, circularity, color, etc. By setting conditions for the sample features, the measurement points can be narrowed down.


Expanded observation capabilities
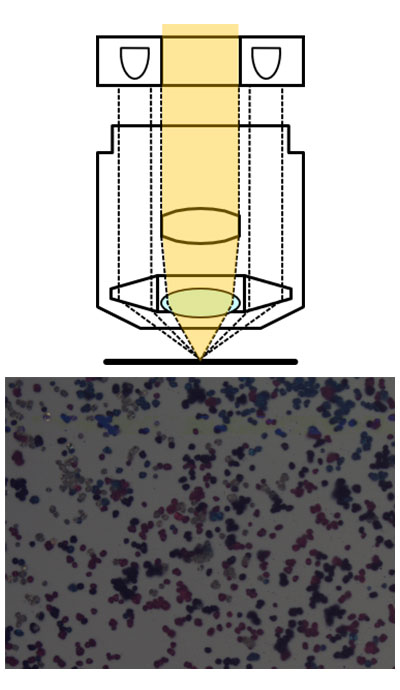
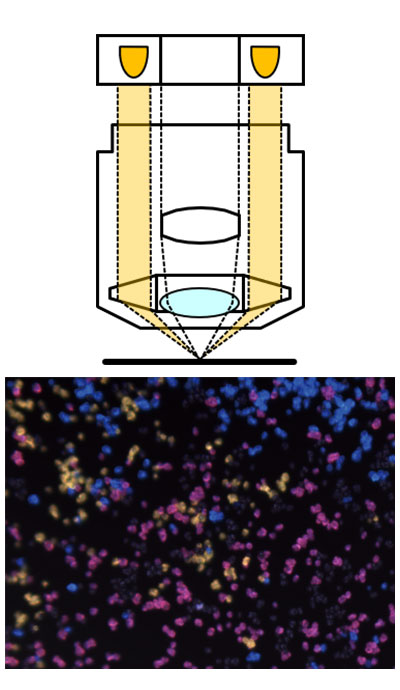
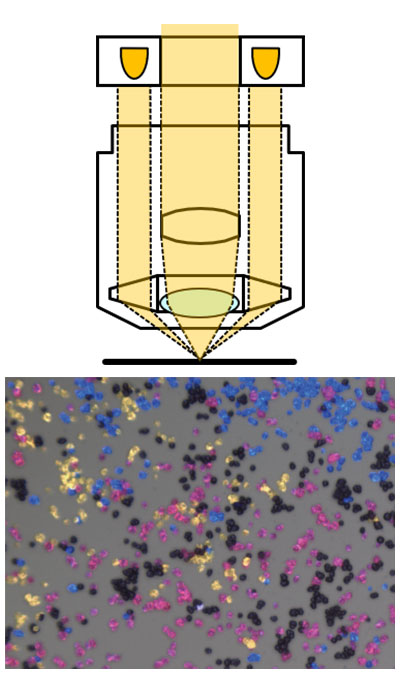
Darkfield observation/MIX observation
Darkfield observation is effective for observing samples with color or fine irregularities. By using MIX observation, which combines the features of brightfield and darkfield observation, it becomes easier to observe samples that are difficult to see using one of the observation methods.
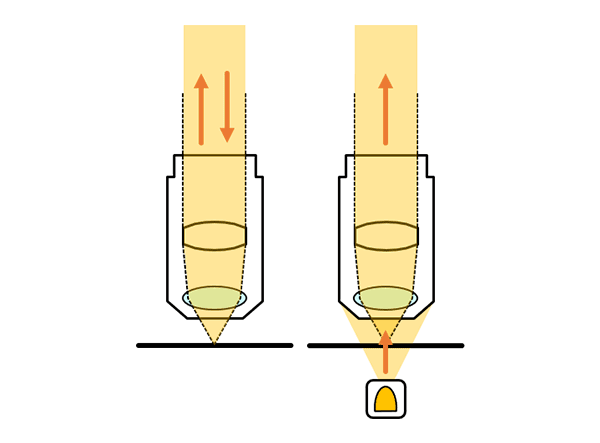
Transmitted light observation
It is effective for observing buried objects and highly permeable samples.
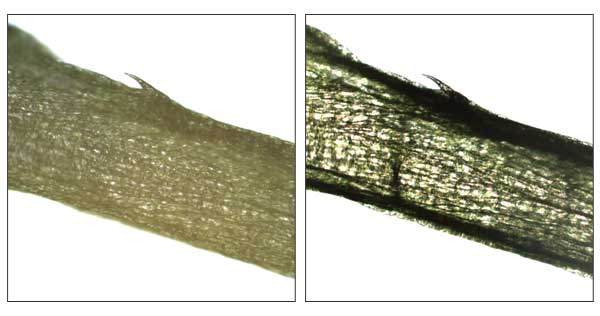
Brightfield (left) and transmitted illumination (right) images of a plant stem
Polarized observation
It allows clear observation of the inner printed surface, which is difficult to see in bright field observation due to the effect of specular reflection from the film surface. Polarized light makes it easier to observe single crystals, minerals, and foreign matter in polymer films.
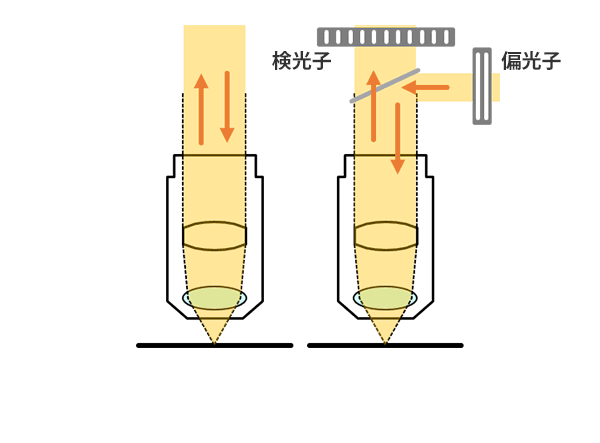
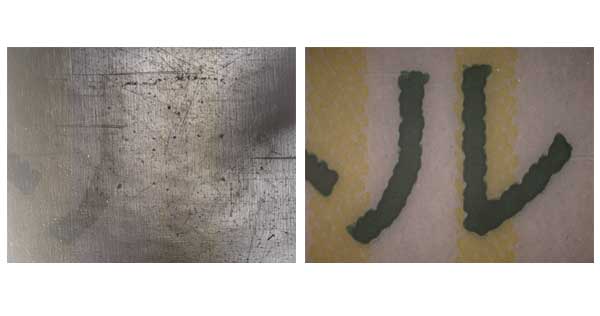
Brightfield (left) and polarized (right) images of the film
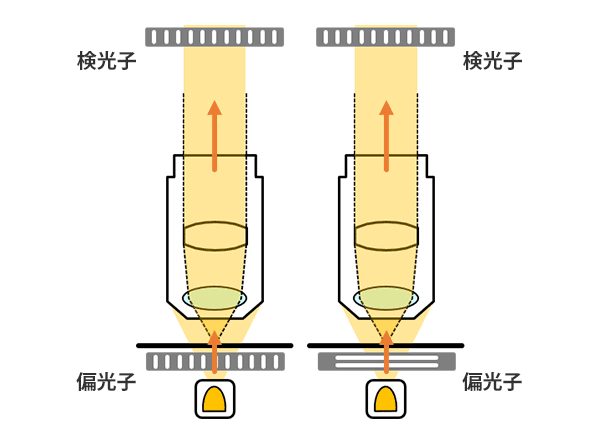
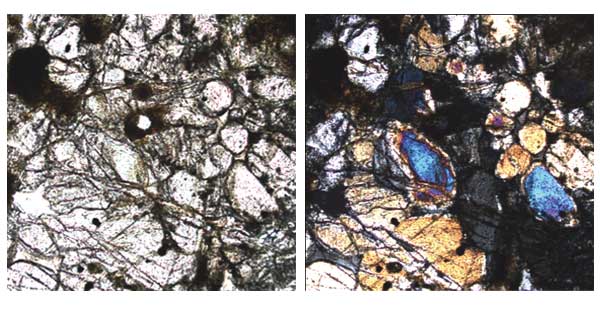
Parallel Nicol (left) and perpendicular Nicol (right) observation images of rocks
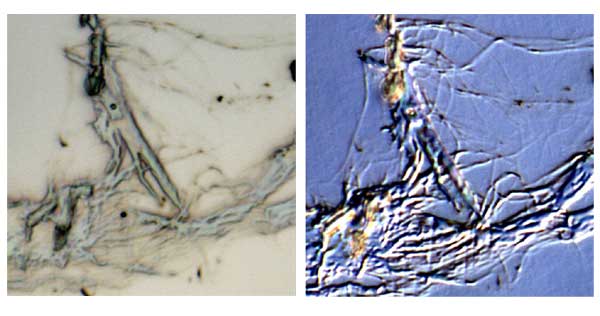
Differential interference observation
By using differential interference, minute irregularities in the sample are highlighted.
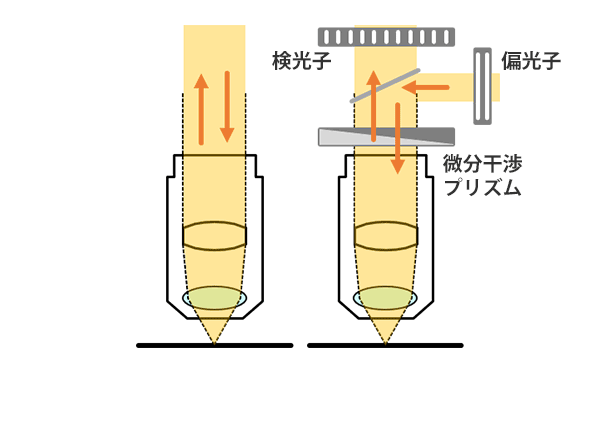
Sharing holder makes it easy to measure the same point
Combined analysis with infrared microscope
By using a sharing holder, it becomes possible to measure the same spot with an infrared microscope and a Raman microscope. Infrared analysis and Raman analysis are complementary, and by acquiring both spectra, it is possible to obtain information that is unique to each technique.
Reload Measurement
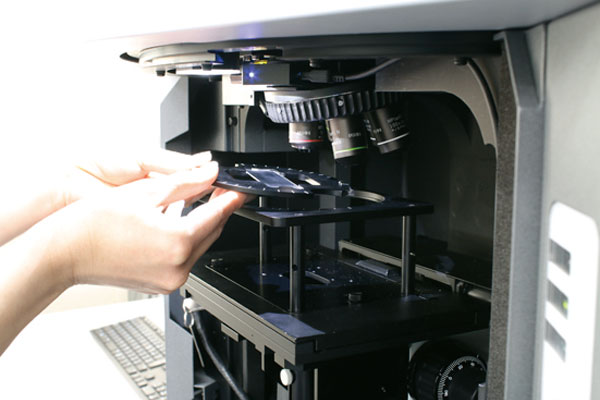
①Resetting the holder
Reinstall the holder that was removed once.
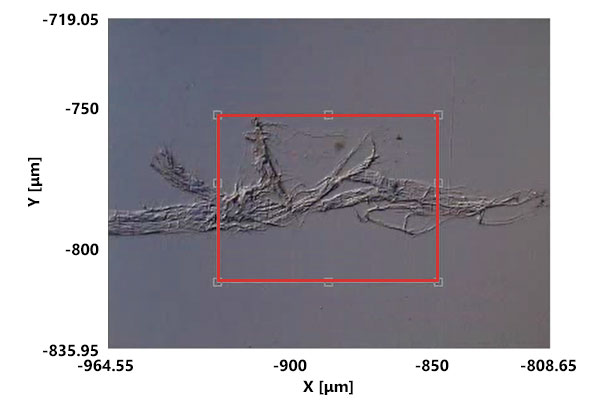
②Specify range
Specify the image range to be used for image matching from the previous measurement data
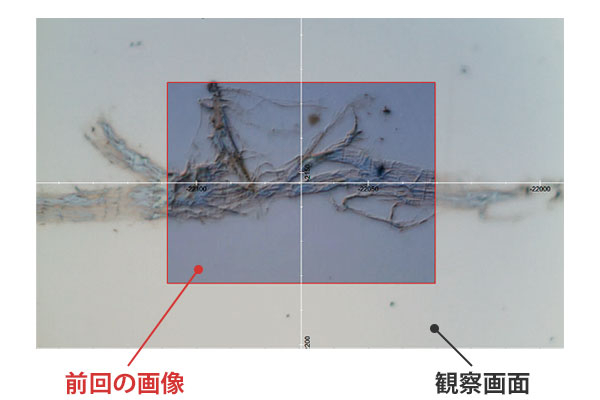
③Automatic alignment
Move to the same point by matching stage coordinate information and image
Imaging measurements that capture samples in “surface” and “three-dimensional” form
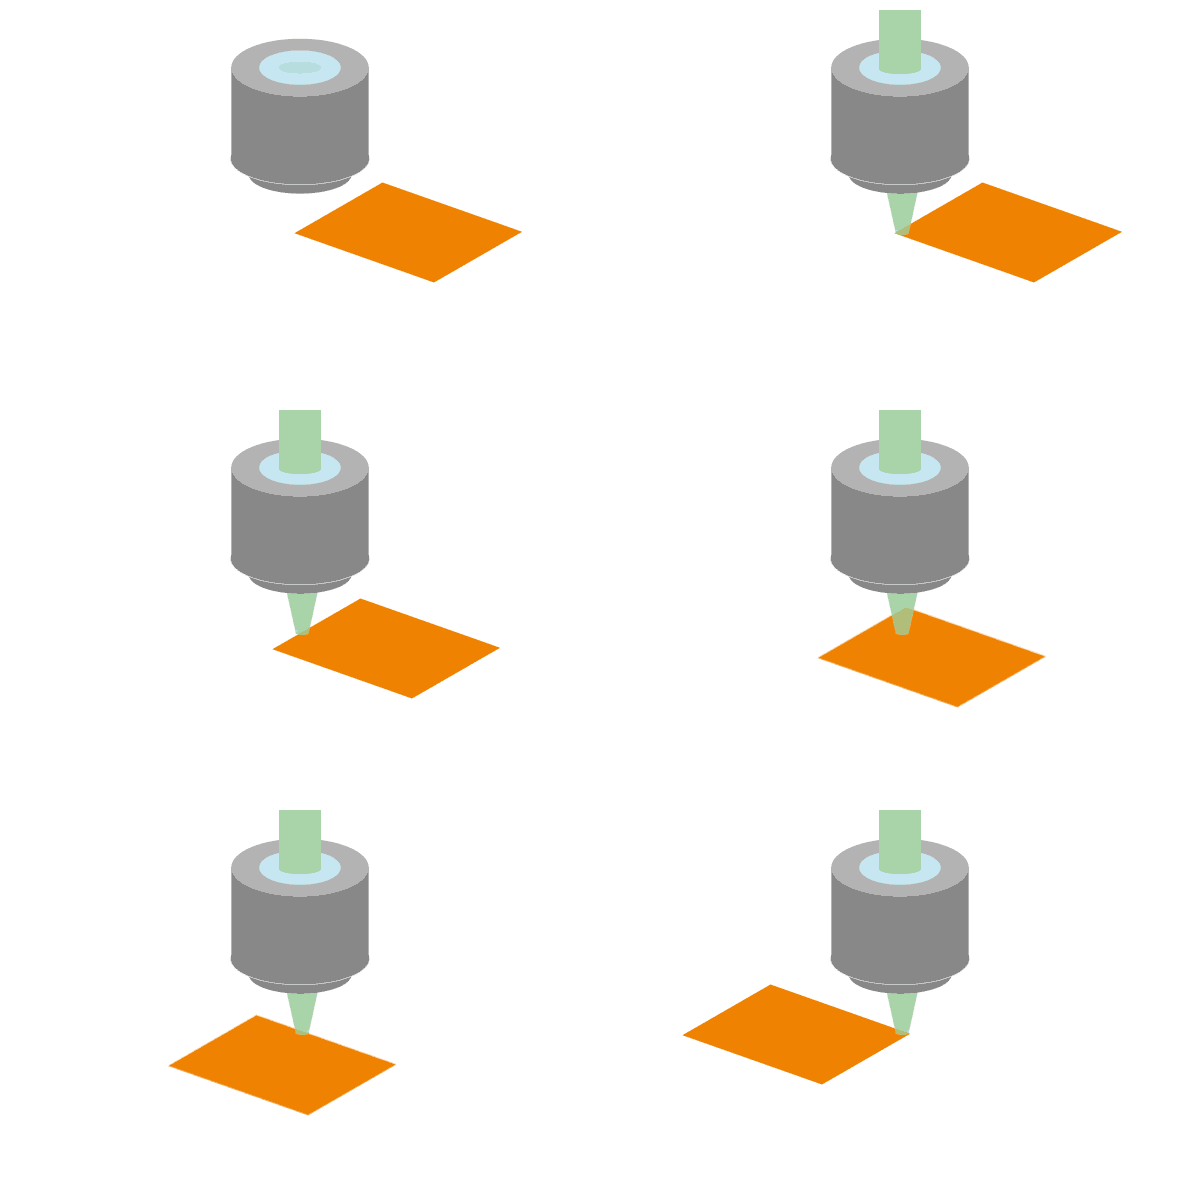
High-speed imaging QRI:Quick Raman Imaging
By using a high-speed, high-precision stage and high-speed data acquisition by the CCD detector, imaging of tens of thousands of points can be obtained in a few minutes. It can handle a wide range of sample sizes, from millimeter order to submicron order.
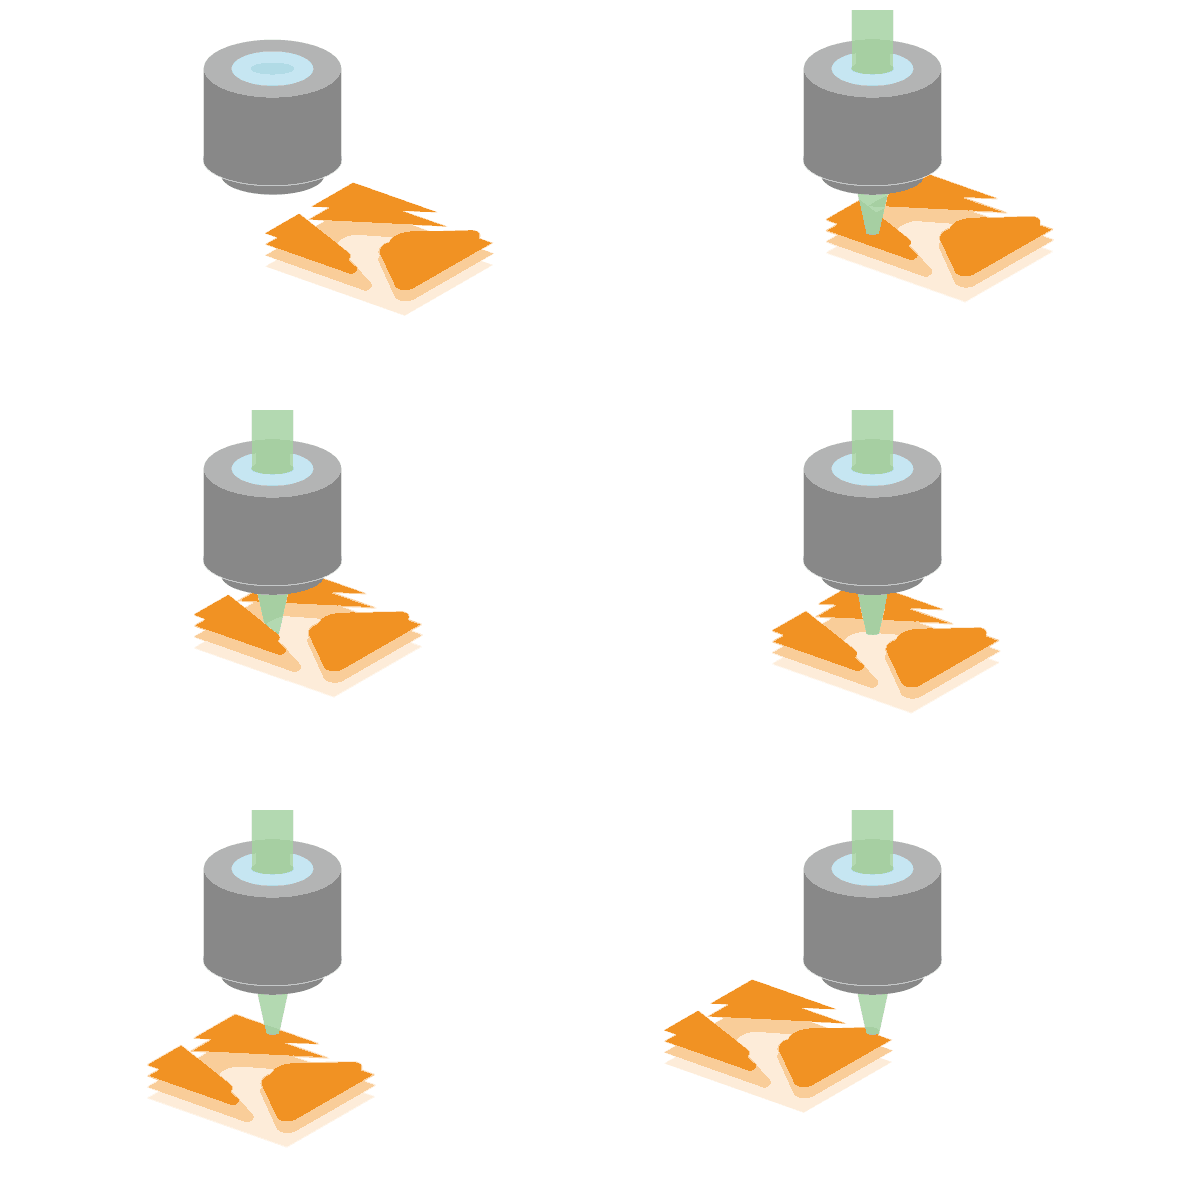
Tracking surface irregularities SSI: Surface Scan Imaging
For samples with unevenness or inclination, the stage is scanned in three dimensions based on the height information obtained from the all-in-focus image to measure the spectrum. No pretreatment is required even for samples with unevenness.
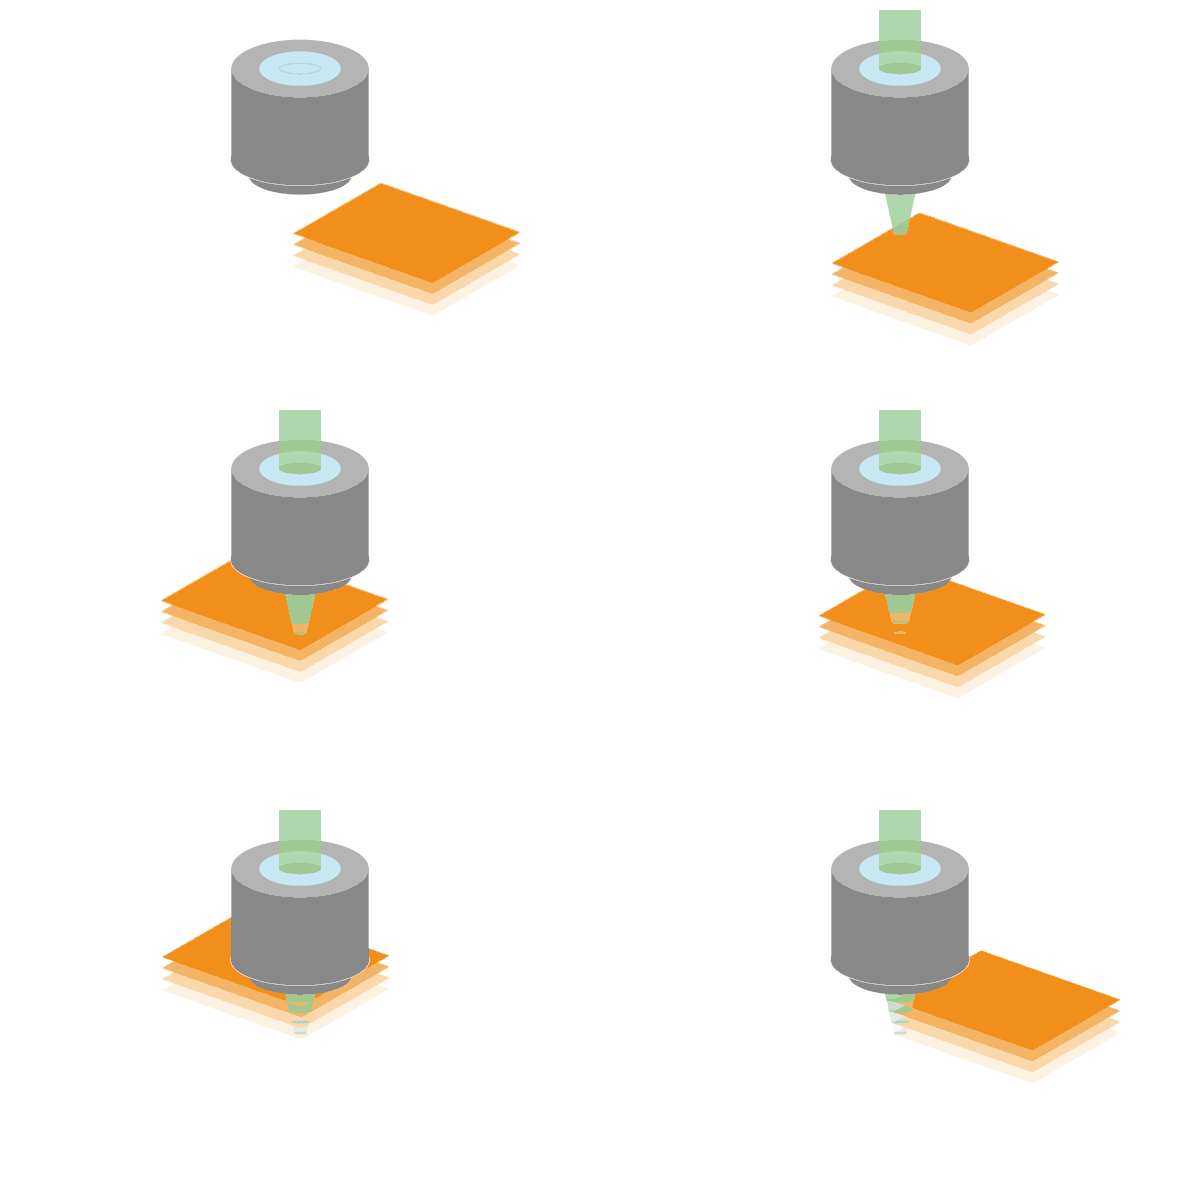
3D Imaging
Using a confocal optical system, Raman imaging is obtained in the depth direction of the sample. It is possible to measure each layer of a laminated film and buried foreign objects non-destructively and without contact.
Easily perform qualitative and imaging analysis
Identification of unknown samples One click to search screen
It includes functions such as searching by spectrum, peak, and structure, multi-component search, and spectrum analysis support. In addition to these functions, it comes standard with a reference library of 645 organic compound spectra and 650 JASCO original spectra. In addition, a Raman database of approximately 25,000 compounds is available as an option.
Create “component distribution image” with simple operations
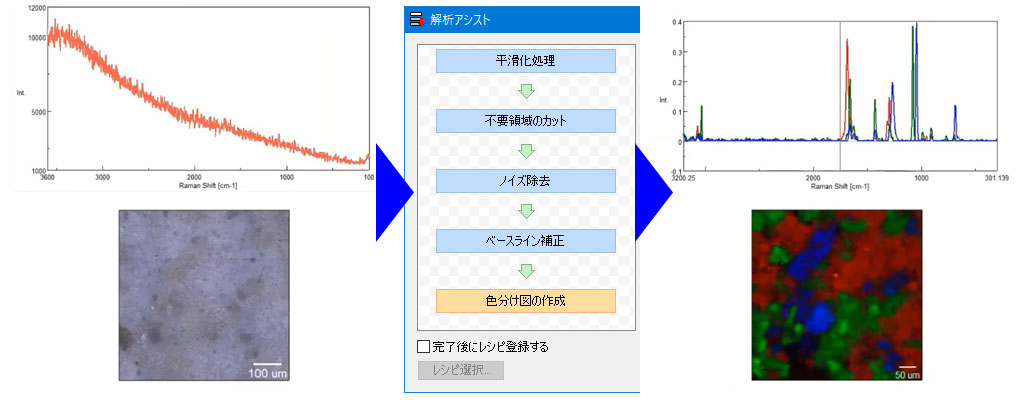
The built-in microscope imaging analysis program allows you to create chemical images with simple operations using peak height, area, half-width, correlation coefficient, multivariate analysis, etc. By using the analysis assistant function, anyone can easily pre-process data and create beautiful color-coded graphs by following the sequence and setting guide.
