Made in Japan
Manufacturer: Kyowa Electronic Instruments Co., Ltd.
Model: PCAS-100A Board Stress Measurement Software
The PCAS-1000A PCB stress measurement set includes software and data acquisition equipment specialized for measurements according to IPC/JEDEC-9704A to easily measure stress on printed circuit boards
Feature
● Easy to use even for beginners in stress measurement
● Equipped with a report function specialized for stress measurement of substrates
Specification
Operating environment
| OS |
Runs in WOW8 (Windows 1-bit On Windows 10-bit) environment on Windows 32.64, Windows 64
Japanese/English, and
64/32-bit compatible 64-bit OS.®® |
| CPU |
Core i5 2GHz or higher recommended |
| memory |
When the OS is 32-bit ,2GB or more When the
OS is 64-bit ,4GB or more |
| display |
Resolution 1024×768 or higher, recommended 1280×1024 or higher |
measurement
| Maximum number of channels |
16 (16 for single-axis strain gauges, 5 for rosette gauges) |
| Channel conditions |
Gauge type (1G2W, 1G3W, 2G2W, 2G3W, 3G2W, 3G3W, Half Bridge, Full Bridge) Gauge rate (200, 500, 1000, 2000, 5000, 10000, 20000με)
gauge rate |
| Measurement mode |
manual, manual (specify the number of acquired data) |
| sampling frequency |
100,200,500,1k,2k,5k,10kHz |
| Lowpass Filter |
10,30,100Hz,FLAT |
| Measurement condition file |
Set measurement conditions can be saved and read |
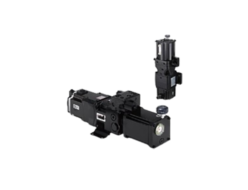
Instrumentation
| Compatible measuring instruments |
PCD-400A/430A (up to 4 units) |
guidance
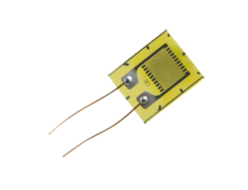
| Gauge selection |
A function that guides strain gauges suitable for printed circuit board stress measurement. |
| Gauge affixing |
A function that explains the procedure for bonding a strain gauge to a printed circuit board on this software. |
Data Monitor
| Time Series Graph |
The X axis can display a time axis, and the Y axis can display graphs of uniaxial strain, maximum principal strain, minimum principal strain, and lick strain. |
| Strain rate graph |
The X axis can display a graph of strain rate, and the Y axis can display a graph of maximum principal strain.
*Strain rate: The amount of change in strain per unit time |
| Y-axis scale |
Auto scale, arbitrary scale (1, 2, 5, 10, 20, 50, 100, 200, 500, 1000, 2000, 5000, 10000, 20000με) can be set. |
Data Acquisition
| Data |
The measured data is stored in the Kyowa Standard File Format (KS2). |
Reporting
| Report Type |
Graphs and tables can be created. |
| Graph Reports |
Time series graphs and strain rate graphs can be reported. |
| Table Reports |
Tabular reports of maximum principal strain, minimum principal strain, lick strain, and strain rate can be created. |
| clipboard |
Copies graphs and tables to the clipboard for use in other software. |
| printing |
Printable reports created. |
| Report Files |
Report File Format (PCR)
Reports can be saved, read, and edited. |