Japan, Kyowa Electronic Instruments Co., Ltd.
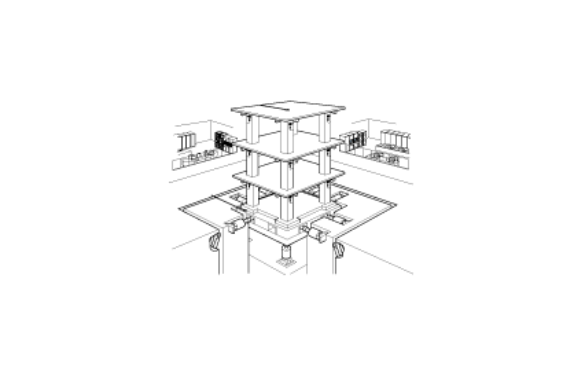
Kyowa Shaking table measurement software
Made in Japan
Manufacturer: Kyowa Electronic Instruments Co., Ltd.
Model: Shaking table measurement software
This software can be configured based on the customer’s wishes, including specifications.
Specification
hardware
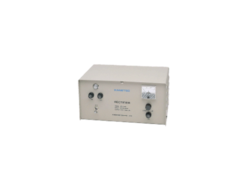
| Example of a typical 256-channel system configuration Bridge box (10 points/unit) 26 units External clock generator 1 relay box 2 External trigger generator 1 rack 1 set Dynamic strain measuring instrument card 32 data loggers with built-in AD conversion 16 32 Connection cable set 1 Uninterruptible power supply 1 set 1 computer set 1 Software set <> |
|
| Usage Environment | Temperature 5~35°CHumidity 20~80%(non-condensing) No induction of dust, vibration, large-capacity electric motor, etc. |
| power | AC 100V |
| Installation method | Indoor stationary type * Hardware will be configured based on the customer’s request. |
software
| Channel information settings | Setting sensor model, engineering value conversion factor, amplifier type, range, filter value, etc., assignment to the input channel of the AD converter |
|---|---|
| Measurement condition setting | Set measurement conditions such as experiment number, sampling frequency, number of sampled data, and monitor display conditions. Monitor display during acquisition includes waveform, power spectrum, and transfer function |
| Sine wave step measurement | Step measurement is performed for each excitation frequency, amplitude and phase difference are calculated for the reference channel, and resonance characteristic diagrams are displayed in real time. Measurement mode can be selected between synchronous mode and manual modeSynchronous mode Automatically performs step-by-step measurement and processing while communicating with the vibration controllerManual mode Manual operation while checking acquisition conditions and results step by step |
| Waveform measurement | General random wave measurements. Real-time monitoring during acquisition and disk-through data storage. (Depends on system configuration.) During acquisition, you can monitor the overrange, and graphically display waveforms, power spectrum, and transfer functions.) |
| data processing | Processing of acquired stored data such as engineering value conversion, data editing, inter-channel calculation, waveform monitoring, frequency analysis, and resonance characteristic diagram creation is possible. |
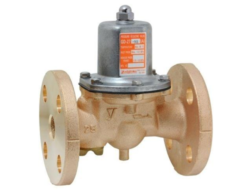
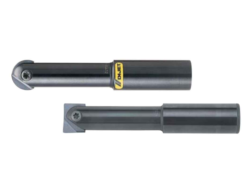
Related Products
REQUEST QUOTATION

PAYMENT

LINK