Operating environment
| software | Complete backup set installed on PC and shipped (CD-ROM) |
|---|
personal computer
| IBM PC/AT compatible machines | |
| OS | Windows 10 Japanese 64-bit support® |
| CPU | Intel Core i5 equivalent or higher |
| memory | 4GB or more |
| display | 1280×1024 or higher Full color |
| interface | 100Base-TX or more |
| printer | Windows Compatible® |
|---|
Data Acquisition Software Specifications
I/O for test condition files
| Load | Select from Explorer |
|---|---|
| preservation | Save with any file name |
| Contents stored | Initial value of test information
channel information graph display |
printing
| What to print | Graph test information channel information |
|---|
Edit study information
| Edit | Test NumberTest NameTest DateMeasurement TimeSampling FrequencyHow to Start Acquisition |
|---|---|
| sampling frequency | EDX-100A compliant |
| How to start acquisition | Manual start-level trigger startexternal trigger start |
Edit channel information
| Edit | acquisition ON/OFFTutingtag
channelnameunitengineering places |
|---|
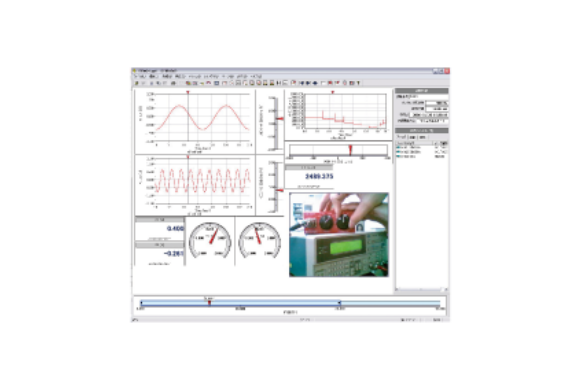
Graph display
| Chart type | Numeric Meter Bar MeterTime Series WaveformXY WaveformFFT Analysis ResultArbitrary |
|---|---|
| Time series waveform | Number of display channels Up to 8 Y-axes Maximum 4 manual scale/auto scale |
| XY waveform | Number of display channels Maximum 4 sets of Y-axes Maximum 4 manual scales / auto scales |
| Frequency Analysis Results | Number of display channels: Up to 4 manual scale/auto scale |
| Display position/magnitude of the graph | Can be changed arbitrarily using the mouse |
Numeric Monitor
| Maximum number of display channels | 128 channels |
|---|---|
| Overrange display | Change background color to display |
Conditioner Auto Balance
| balance | EDX-100A compliant |
|---|---|
| Balance measurement | Average value for 1 second |
Data Acquisition Software Specifications
Internal sensitivity correction of conditioner
| EDX-100A compliant |
Data Acquisition Software Specifications
Initial value measurement
| Measurement object | Select any of the channels to be acquired |
|---|---|
| sampling frequency | 1kHz |
| Measurement time | 10 seconds |
Data Acquisition
| Maximum number of channels | 128 channels |
|---|---|
| Maximum measurement time | Approx. 2 seconds for 32-channel measurement with a sampling frequency of 600 kHz |
| Graph display | FFT analysis results are 2 kHz or less and others up to 100 kHz (however, if it exceeds 2 kHz, thinning is displayed) |
| Data | SPIRAS6 Format |
Instrumentation
| EDX-100A | Up to 4 units (CF card required) |
|---|
Data Processing Software Specifications
I/O for measurement data files
| Load | Select from Explorer |
|---|---|
| Readable data types | SPIRAS6 formatKyowa Standard Format (KS1, KS2) CSV format text file |
| preservation | Edited data can be saved with a name |
| Types of stored data | SPIRAS6 Format CSV Format Text File |
printing
| What to print | graph |
|---|
Changing the Processing Scope
| How to change | Setting with a numeric input mouse on the input screen |
|---|
Cross-channel operations
| Number of channels | Up to 100 channels can be registered |
|---|---|
| Setting items | tag namechannel name unit calculation content |
| Calculation details | Arbitrary arithmetic functions (square root, square, trigonometric function, logarithm, natural logarithm, power of e, absolute value, exponentiation) Differentiation (1st floor, 2nd floor) Integral (1st floor, 2nd floor) |
| Integration method | Trapezoidal law |
Digital Filters
| way | Settings by channel |
|---|---|
| method | IIR Butterworth |
| Blocking characteristics | −12dB/−24dB/−48dB/oct (theoretical value) |
| kind | Low Pass,High Pass,Bandpass |
Detrending
| way | Settings by channel |
|---|---|
| Removal method | Linear trend/mean/input/polynomial approximation |
moving average
| way | Settings by channel |
|---|
Graph display
| Chart type | Numeric Meter Bar MeterTime Series WaveformXY WaveformVideo (AVI File)Arbitrary Text |
|---|---|
| Time series waveform | Number of display channels Up to 8 channels Number of Y-axes Maximum 4 manual scales / Auto scale |
| XY waveform | Number of display channels Maximum 4 sets of Y-axes Maximum 4 manual scales / auto scales |
Data Processing Software Specifications
Graph display
| FFT Analysis | Analysis Type Linear spectrum, power spectrum, PSD, cross spectrum, transfer function, coherence, autocorrelation, number of crosscorrelation 75% |
|---|
Data Processing Software Specifications
Graph display
| Frequency analysis | Analysis Type Amplitude method, 1D rainflow, 2D rainflow, Maximum minimum value method, Maximum maximum minimum display number of channels 1 channel |
|---|---|
| Display position/magnitude of the graph | Can be changed arbitrarily using the mouse |
Statistics display
| Number of channels | Optional Channel |
|---|---|
| Statistic Type | maximum, maximum time, minimum value, minimum time, average value |
| * Frequency analysis and frequency analysis are optional. |